
















GALLIUM NITRIDE GaN Reliability: From test-to-fail testing to real-world lifetime prediction
Related Vendors


Gallium nitride (GaN) based power transistors enable higher switching frequencies, higher power density and lower switching losses in power conversion systems. But as they find more use in power supplies, solar inverters, DC-DC converters, lidar and motor drives, one question is key for system designers: how long will a GaN device operate reliably in the real world?

Answering this question requires more than demonstrating that a component passes a qualification test. Engineers need to understand the physical mechanisms that can cause a device to degrade, how those mechanisms respond to electrical and thermal stress, and how the resulting data translate into an application-specific lifetime prediction.
Why passing a qualification test is not the same as predicting lifetime
Semiconductor qualification testing typically applies defined electrical, thermal, or environmental stresses for a specified duration or number of cycles. Devices are evaluated against established acceptance criteria, with the objective of demonstrating that the tested population (of devices) meets the requirements under those conditions.
These tests are essential, but they answer a specific question: does the device satisfy the qualification criteria for the prescribed test?
They do not necessarily establish how long the device will last across every combination of voltage, current, temperature, switching frequency, and operating duration encountered in a real application.
Two systems using the same GaN transistor may experience substantially different reliability conditions. One converter may operate at a relatively stable temperature for most of its lifetime. Another may repeatedly experience significant temperature excursions during startup, shutdown, or changes in load. Even if both systems use the same device, their dominant reliability risks may differ.
To understand these differences, reliability engineering must identify the underlying failure mechanisms and determine how each mechanism develops under different stress conditions.
This is where test-to-fail methodology becomes particularly valuable.
Test-to-fail methodology: Understanding how devices fail
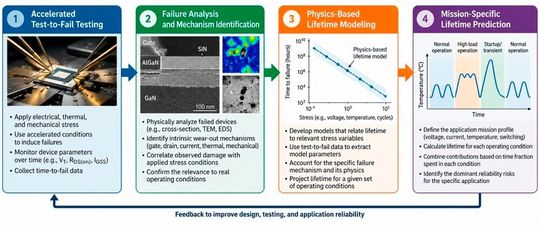
Rather than stopping when a device passes a predefined test, test-to-fail methodology deliberately subjects devices to accelerated stress until failures occur. The objective is to identify the physical mechanisms responsible for failure and establish how they depend on the applied stress.
Relevant stressors for GaN power transistors include:
- Gate-source voltage stress: electrical stress applied between the gate and source terminals.
- Drain-source voltage stress: electrical stress associated with the drain-source electric field.
- Current stress: continuous or pulsed current, including conditions involving high power dissipation.
- Thermal stress: elevated temperatures or repeated temperature changes.
- Mechanical stress: forces affecting the device, package, solder joints, and PCB assembly.
These stressors can be applied in various ways. For example, voltage may be applied continuously, switched periodically, or introduced as high-speed pulses. Temperature can be held at a given level or cycled up and down.
The distinction is important as different stress conditions can induce different failure mechanisms.
Accelerated testing can generate failures within a practical lab time frame enabling engineers to collect time-to-failure data. The results require careful interpretation, however. A failure mechanism that does not occur during normal operation may be triggered if the applied stress is too severe or poorly chosen.
Therefore, electrical measurements are not sufficient on their own. Failure analysis must identify the physical source of the observed degradation and confirm that the proposed mechanism is consistent with the test conditions.
When the mechanism is understood the results can be used to develop a model relating device lifetime to the relevant operating stresses.
This approach is especially important for GaN, since lifetime models developed for silicon MOSFETs cannot be automatically assumed to describe GaN HEMTs under extreme or long-term electrical stress.
Table 1: Stress Conditions and Intrinsic Wear-Out Mechanisms [1]
| Stressor | Device/ | Test Method | Intrinsic Failure |
| Voltage | Device | HTGB | Dielectric failure (TDDB) |
| Threshold shift | |||
| HTRB | Threshold shift | ||
| RDS(on) shift | |||
| ESD | Dielectric rupture | ||
| Current | Device | DC Current (EM) | Electromigration |
| Thermomigration | |||
| Current + Voltage (Power) | Device | SOA | Thermal Runaway |
| Short Circuit | Thermal Runaway | ||
| Voltage Rising/Falling | Device | Hard-switching Reliability | RDS(on) shift |
| Current Rising/Falling | Device | Pulsed Current | None found |
| Temperature | Package | HTS | None found |
| Humidity | Package | MSL1 | None found |
| H3TRB | Dendrite Formation/Corrosion | ||
| AC | None found | ||
| Solderability | Solder corrosion | ||
| uHAST | None found | ||
| Mechanical / | Package | TC | Solder Fatigue |
| IOL/Power Cycling | Solder Fatigue | ||
| Bending Force Test | Delamination | ||
| Bending Force Test | Solder Strength | ||
| Die shear | Solder Fatigue | ||
| Package force | Film Cracking | ||
| Radiation | Device | Gamma Radiation | None found |
| Neutron Radiation | None found | ||
| Heavy Ion Bombardment | Crystal displacement damage |
From failure mechanisms to quantitative lifetime models
Identifying a failure mechanism is only the first step. The next challenge is to quantify its impact on device lifetime.
The physics-based lifetime model relates an applied stress to the time to reach a specified level of degradation or failure. Relevant variables are voltage, temperature, current, stress duration and number of applied cycles depending on the mechanism.
The Phase 18 Reliability Report examines several different wear-out mechanisms including gate wear-out, drain related degradation, current density related wear-out, thermomechanical wear-out and mechanical stress.
For each mechanism, a suitable model and experimental support are required.
For example, drain stress in GaN HEMTs can cause an increase in dynamic on-resistance, also known as dynamic RDS(on). The report analyzes electron trapping in high electric field regions and provides a physics based model to estimate the evolution of on-resistance with time.
Thermomechanical wear-out presents a different problem. Repeated temperature changes can generate mechanical strain because the device, solder interconnects, package, and PCB have different coefficients of thermal expansion. In this case, the resulting fatigue and solder-joint cracking must be considered when estimating lifetime.
These examples illustrate an important point: there is no single degradation mechanism or lifetime model that adequately describes every reliability risk in every application.
Engineers must first identify the relevant mechanisms, characterize their behavior, and then combine their contributions to evaluate the overall reliability of the device.
FIT and MTTF: Connecting individual failure mechanisms
Two commonly used reliability metrics are Failure in Time (FIT) and Mean Time to Failure (MTTF).
FIT expresses a failure rate, conventionally as the number of failures per (10^9) device-hours. MTTF expresses the mean time to failure under the conditions being considered.
For a constant failure-rate model, the relationship is:
When FIT is expressed as failures per billion device-hours and MTTF is expressed in hours.
When multiple independent failure mechanisms contribute to the overall failure rate, their
The corresponding total MTTF is then inversely related to the combined failure rate.
This framework helps engineers identify the mechanism that contributes most strongly to the overall reliability risk. A device may demonstrate excellent gate reliability, for example, while package-level thermomechanical stress remains the dominant lifetime limitation.
The practical implication is significant: improving an already low-risk mechanism may deliver less benefit than addressing the mechanism that currently limits the system’s lifetime.
These calculations also require appropriate assumptions about failure-rate behavior, statistical independence, and the operating conditions represented by the underlying data. MTTF is a statistical metric, not a guarantee that an individual device will operate for that exact duration.
Why the mission profile changes the reliability prediction
A device rarely operates under one constant set of conditions throughout its service life. Its voltage, current, temperature, and switching activity may vary significantly over time.
A mission profile describes these operating conditions and their duration over the intended application lifetime.
Consider two systems using the same GaN device:
- A DC-DC converter operating under relatively stable thermal conditions.
- A power converter exposed to repeated startup events, load changes, and temperature excursions.
Their lifetime predictions should not automatically be identical. The second system may experience a different combination of electrical and thermomechanical stresses, changing which failure mechanism dominates.
The Phase 18 Reliability Report provides a framework for evaluating these varying conditions. If a mission consists of several operating states, each state contributes according to both its duration and the lifetime associated with its particular stress conditions.
A simplified expression is:
where:
- Ltotal is the projected lifetime under the complete mission profile.
- Li is the projected lifetime under operating condition (i).
- fi is the fraction of total operating time spent under that condition.
This relationship assumes that the stress-specific lifetimes can be combined using the report’s lifetime model. It should not be interpreted as a universal model for every degradation process or as a substitute for identifying the relevant failure mechanisms.
Its value is that it accounts for the time spent under different operating conditions rather than treating the entire mission as a single, constant stress.
Temperature cycling illustrates why this distinction matters. The amplitude of a temperature excursion, its maximum temperature, and the rate at which the temperature changes can all affect thermomechanical lifetime. Replacing a complex temperature history with a single average temperature can therefore produce a misleading prediction.
Applying the methodology to real power electronics
The Phase 18 Reliability Report applies its mission-specific framework to solar power conversion, DC-DC converters, lidar, and motor drives.
These applications illustrate why reliability must be evaluated in context.
Solar power conversion: Microinverters and power optimizers must operate for decades in outdoor environments. Gate bias , drain bias and temperature cycling must be evaluated in terms of actual application conditions . Temperature cycling is the main concern in the studied solar example identified by the EPC study. With proper underfill materials, the thermomechanical risk involved can be greatly reduced.
DC-DC converters achieve high power density using high switching frequencies and compact packaging, but the relevant electrical and thermal stresses still need to be evaluated. Analysis in the report shows that, under the modeled conditions, thermomechanical stress associated with temperature cycling is a bigger reliability concern than gate or drain wear-out.
Lidar: Very long operating periods of continuous high-current pulsed operation of GaN devices and integrated laser-driver circuits are possible. It is useful to assess the stability of device parameters and system waveforms under representative pulse conditions to establish suitability for the intended mission.
Motor drives: Battery-powered systems, such as robotic platforms, can experience rapid current transients during startup, acceleration, and stall events, followed by periods of lower power operation. Reliability testing that replicates these changing conditions provides more application relevant evidence than a test based on steady state operation alone.
These examples do not establish one universal lifetime for GaN. Instead, they demonstrate how the same reliability framework can be applied to different operating environments, with different dominant stressors and design priorities.
What engineers should take away
A meaningful GaN reliability assessment requires a chain of evidence, consisting of accelerated testing, identification of physical failure mechanisms, quantitative lifetime modeling and assessment against the intended mission profile.
The practical workflow for power electronics designers is the following:
- 1. Define the profile of the mission. Set out the expected voltage, current, temperature, switching conditions and operation times.
- 2. Identify the pertinent stressors. Determine electrical, thermal and mechanical conditions that may limit device lifetime.
- 3. Look at the proof. Identify the underlying mechanisms by means of test-to-fail data and physical failure analysis.
- 4. Quantify life time. Estimate the contribution of each relevant mechanism using validated models.
- 5. Control the leading risk. Design and packaging improvements should be focused on the mechanisms with the most significant impact on the predicted lifetime.
- 6. Validating the Application. Verify that the test conditions, model assumptions, and resulting predictions are representative of the system modeled.
The central lesson is that GaN reliability should not be reduced to a single qualification result or a generic lifetime number. It must be evaluated using the physical behavior of the device and the stresses it will experience throughout its intended service life.
By connecting test-to-fail results with physics-based lifetime models and mission-specific conditions, engineers can make more informed design decisions and better understand the reliability margins of GaN power conversion systems [2].
References
[1] S. Gajare, D. Li, R. Garcia, A. Espinoza, P. Tieu, J. Green, J. Yee, D. Wu, C. Wong, and S. Zhang, “GaN Reliability and Lifetime Projections: Phase 18,” Efficient Power Conversion (EPC), Reliability Report, 2026.
[2] A. Lidow, M. de Rooij, J. Glaser, A. Pozo Arribas, S. Zhang, M. Palma, D. Reusch, and J. Strydom, GaN Power Devices for Efficient Power Conversion, Fourth Edition.
(ID:51002846)

